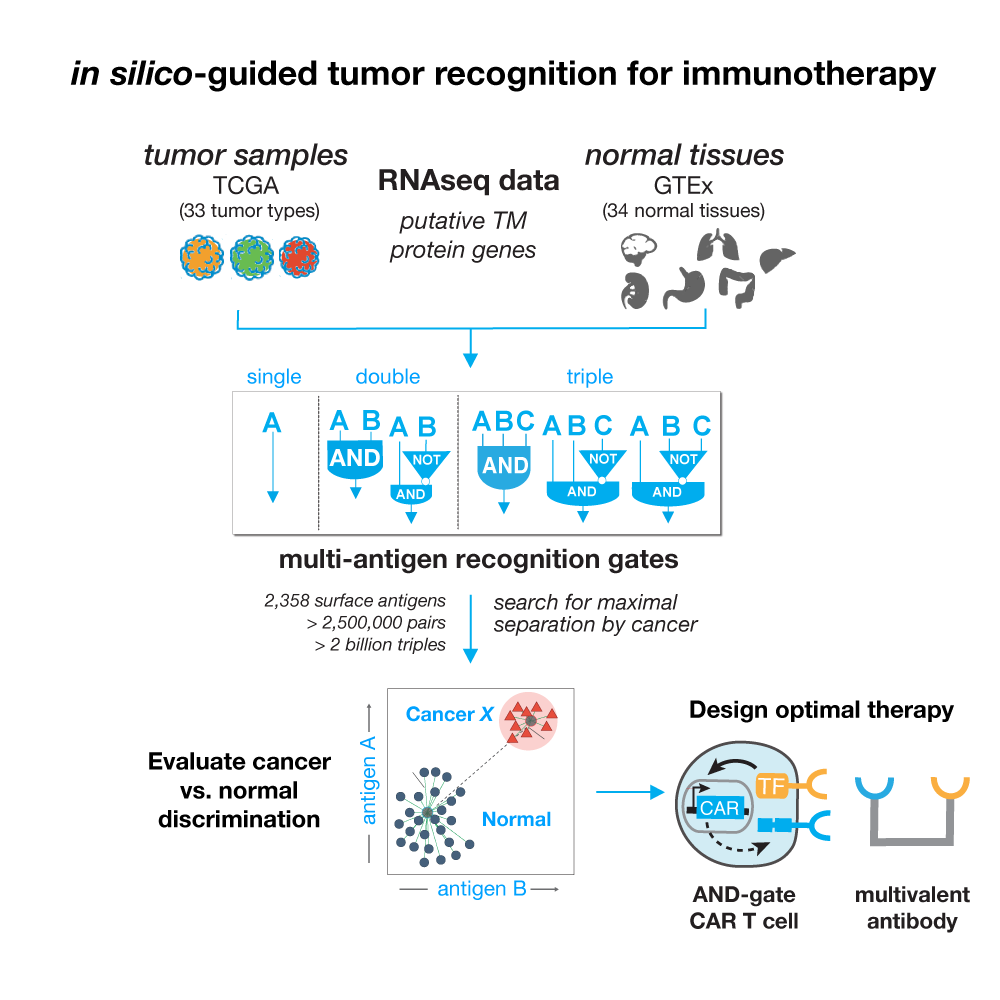
This webserver was designed as a resource for developing novel immunotherapeutics that harness multi-antigen signatures to improve cancer recognition and limit normal tissue cross-reactions. The expression data shown here cover 33 tumor types and 34 normal human tissues utilizing 21,486 samples taken from The Cancer Genome Atlas and the Genotype-Tissue Expression (GTEx) Project v7. We examine 2,358 protein-coding genes annotated to be expressed on the cell surface or that are targets in current clinical immunotherapy trials. The antigen types are referred to as novel (N) or clinical (C) antigens respectively.
While transcriptomics data does not directly reflect protein abundance, we use the expression levels of genes encoding surface proteins as an initial prediction of therapeutic potential. When gene combinations can separate normal tissue samples from cancer samples well in expression space it is likely that they are good candidates for further clinical investigation. We quantified the separation potential of all antigen combinations using a distance based heuristic inspired by clustering evaluations as well as decision tree classifiers. Together top scoring combinations (combined scores of 1) are the best at normal tissue vs tumor descrimination.
Because the space of potential combinations is vast (to analyze any two antigens is it 2.5 million pairs!), we reduce our predictions shown in the webserver to the top 100 per tumor type per antigen type (novel / clinical). We also limit the number of times a single gene can appear in a combination, keeping only its top 2 highest scoring pairings. Any of the 2,358 genes can be searched and the expression of the combination plotted with an interactive scatterplot.
Ideal antigens must separate tissue samples from tumor samples and have large differences in gene expression (very distant). To assess both of these qualities we use several metrics which are listed in our predictions both on the browse page and in single gene searches. Here are brief descriptions of the scores we have calculated. More rigorous definitions can be found in our paper.
- Combined Score: The minimum of both F1 and the clustering score. Where F1 is the harmonic mean of precision and recall and represents perfect classification performance when equal to 1; and the clustering score a scaled combination of Davies-Bouldin and the Manhattan distance of the centroids (normal and tumor) normalized such that 1 is the best clustering score across all combinations.
- DB (Davies-Bouldin): A measure of both the separation between two clusters and their compactness (how close samples of the same type are). Lower values of DB are better and indicate - tight clusters separated far apart.
- Distance: The Manhattan distance of the distance between the normal and tumor centroids. Larger values are better.
- Precision: With decision trees we were able to draw the optimal boundary to separate tumor samples from all normal tissue samples. In many cases there is no boundary that will perfectly separate tumor and normal samples. Thus, precision indicates the number of cancer samples correctly classified as cancer (with in the cancer boundary- will call this the target) / the total number of samples in the target. Boundaries were drawn on 80% of the data and the held out 20% of the data was used to calculate precision.
- Recall: The boundaries drawn by decision tree classifiers (as described in precision) may miss some cancer samples. That is - they fall outside of the boundary of what is predicted to be "cancer" (aka the target boundary). Recall then measures out of the samples in the target boundary how many are cancer / the total number of cancer samples in the data. E.g, a recall of 0.6 would have 60% of cancer samples falling in the target boundary, but be missing the other 40% of cancer samples.
- Gate: Advances in cell engineering now allow for NOT logic. Pairs that have low (L) expression would be good candidates for NOT gating.
- Antigen Type: If a gene encodes an antigen currently used or under investigation in clinical trials it is called a clinical (C) for short. The remainder of surface antigens are novel (N) not currently under investigation.
Further details on this work can be found in our paper published in Cell Systems. Please cite this work if you use our results in a publication:
Discriminatory power of combinatorial antigen recognition in cancer T cell therapies. Dannenfelser R, Allen G, VanderSluis B, Koegel AK, Levinson S, Stark SR, Yao V, Tadych A, Troyanskaya OG, Lim WA. (2020) Cell Systems.
The antigen explorer webserver was created in the Troyanskaya Laboratory for Bioinformatics and Functional Genomics in the Lewis-Sigler Institute for Integrative Genomics at Princeton University in conjunction with the Lim Laboratory at UCSF. Use is protected under an academic and commercial license. If interested in licensing antigen combinations for use in therapeutic developement, please contact Todd Pazdera at UCSF.